Tables, diagrams and illustrations
The following graphic images open as individual images and can be enlarged when printing to use as handouts.
Cartoon graphics
Ways that HIV is not transmitted
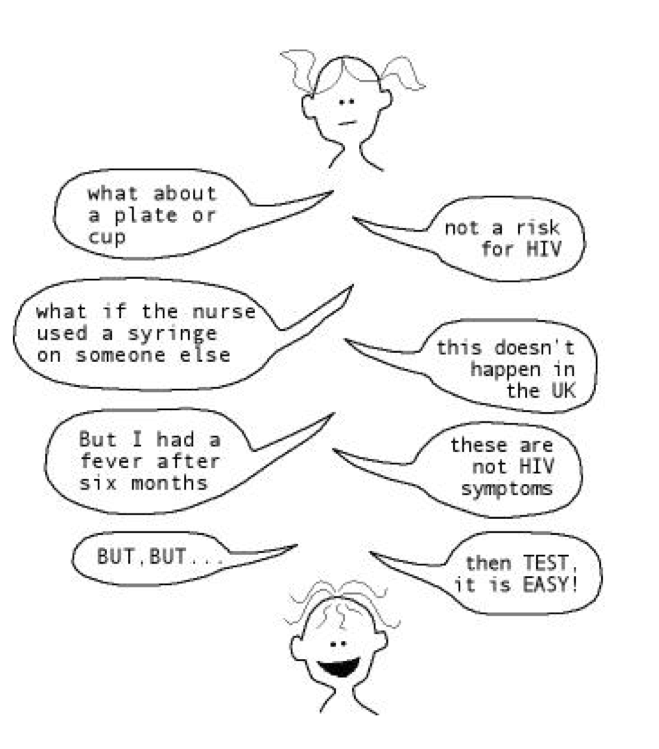
HIV testing: feelings of fear, anxiety and guilt
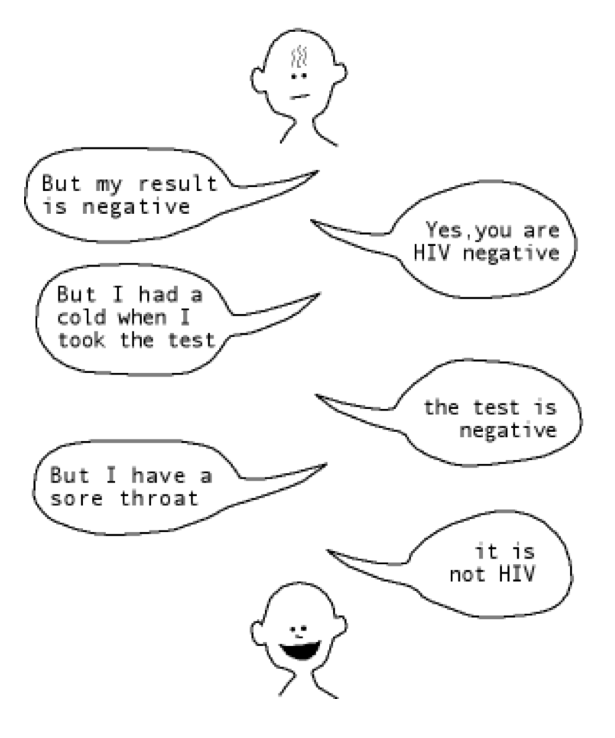
How can my partner test positive and I test negative?

Figures
Figure 1: Common risks for transmission

Figure 2 – Viral load levels as HIV infection progresses
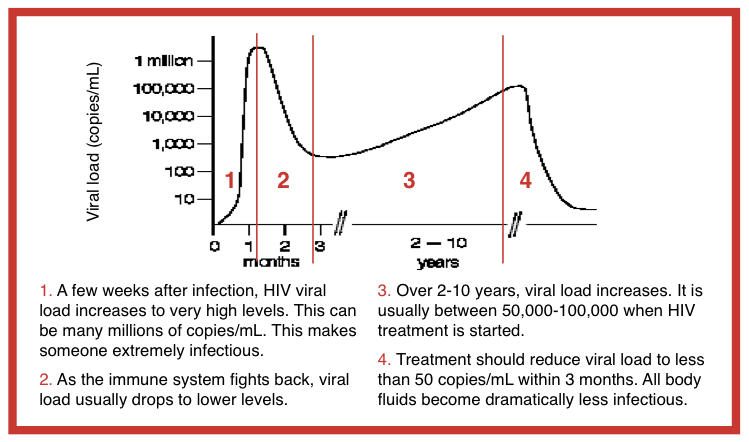
Figure 3 – The relationship between viral load and HIV transmission in Rakai Study [3]
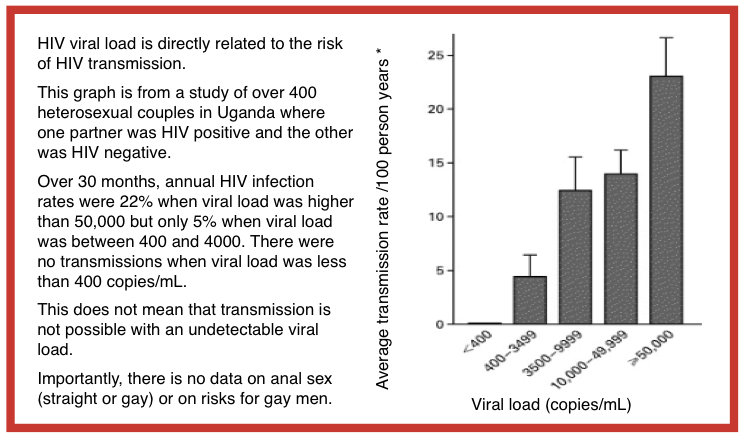
Figure 4 – How to use a male condom

Figure 5 – Using a female condom

Figure 6: Recommended time from exposure to HIV test

Figure 7: Time to develop antibodies:
95% people do this by week 4 and more than 99.9% by week 12

Figure 8: Timeline for HIV infection, immune responses and window period for tests
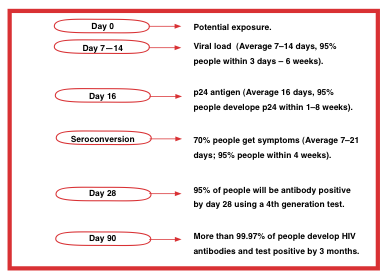
Figure 8 shows the range of times that people can take to respond to HIV infection.
- The earliest marker is HIV viral load. This is in the first weeks after infection (usually from 1 to 6 weeks after exposure). A high viral load is related to seroconversion symptoms.
- The first HIV protein (antigen) that can be measured is p24 (from 1 to 8 weeks after exposure).
- Viral load and p24 tests are not accurate for diagnosing early HIV if the results are negative.
- An HIV antibody response can be detected as early as two weeks in a few people and in more than 99.9% of people by 12 weeks. An antibody test at 4 weeks will detect 95% of infections.
- Antibody testing at 4 weeks can give you a good indication of your HIV status, but you need a test at 12 weeks after the exposure to be considered HIV negative.
Figure 9: Cell structure of skin and mucous membranes

Figure 10: How HIV crosses skin or mucosal barriers

Figure 11: Timeline for HIV infection, immune responses and window period for different tests
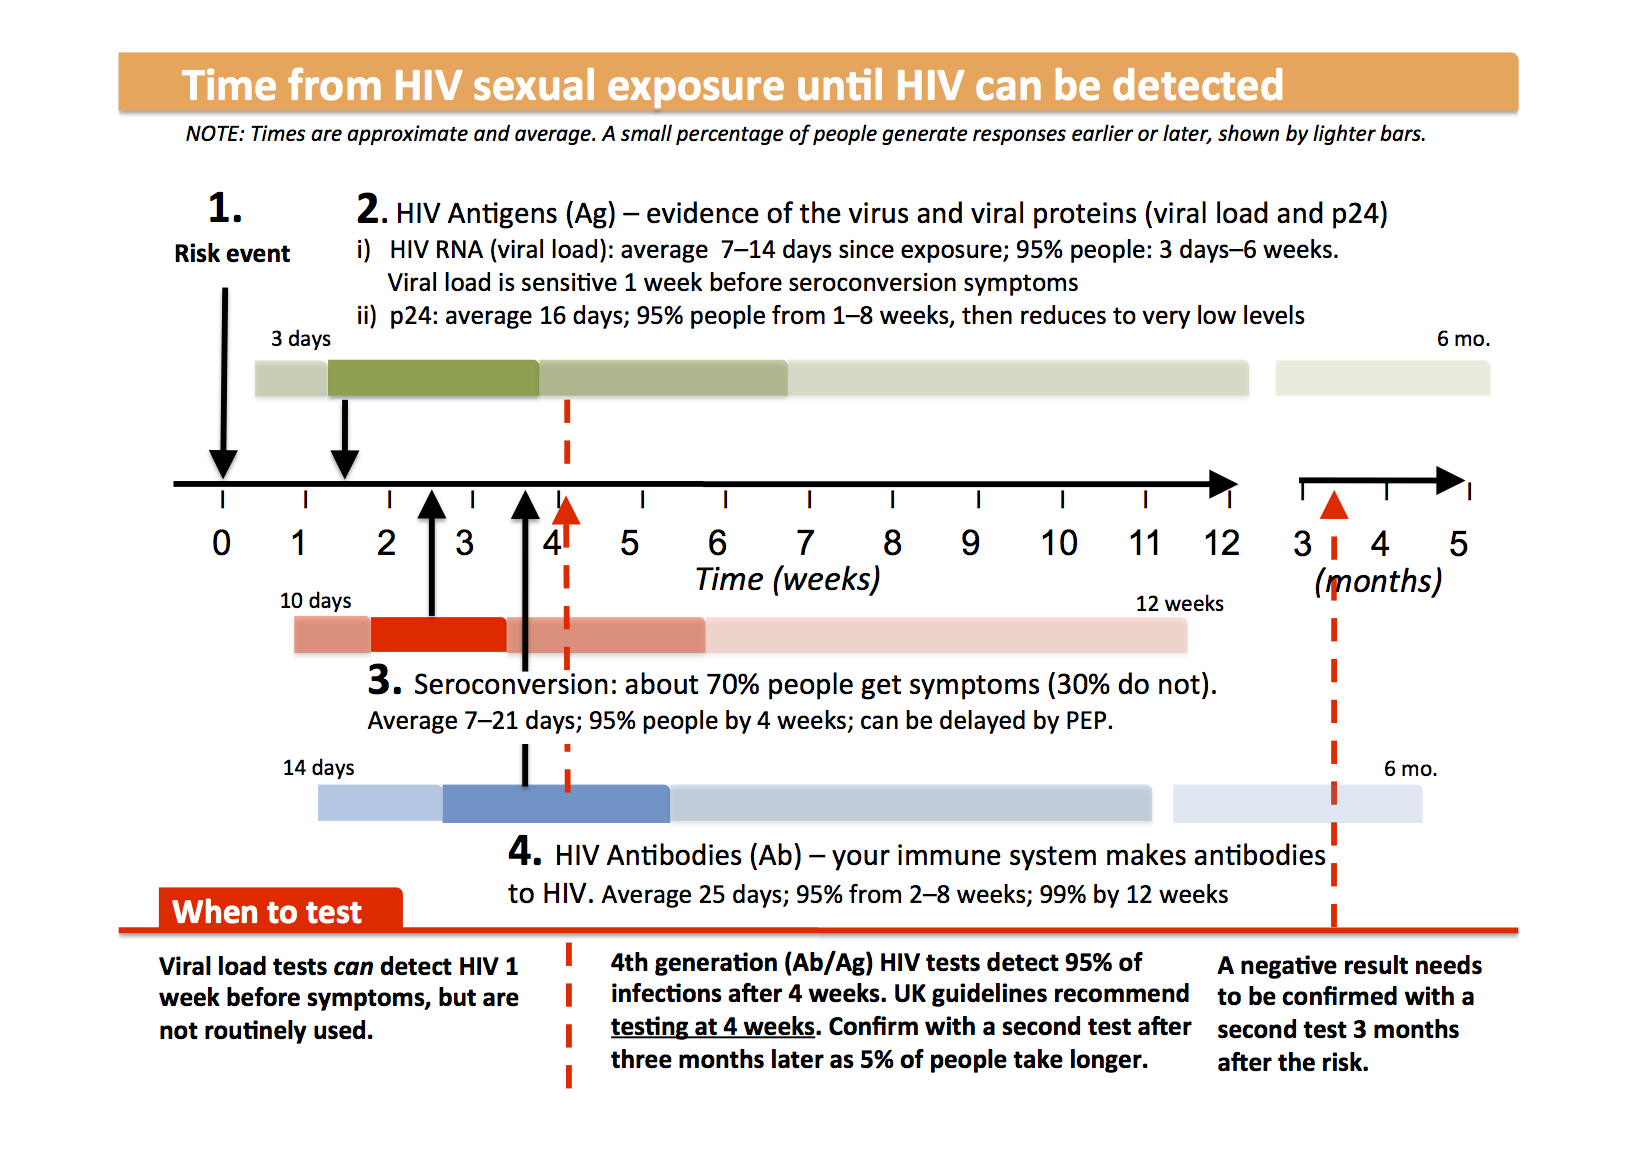
Figure 12 – Different types of HIV test

Figure 13 – Average time after exposure to detect HIV antigens and antibodies

Figure 14: Diagram of a Y-shaped antibody
The variable region – the antigen binding site (in yellow) and the constant region (in light blue)

Figure 15: How antibodies and antigens interact

Diagrams for risk factors
You and your partners HIV status

Viral load

Sexual activity and condom use

Oral sex

Sexual fluid

Duration of unprotected sex

Vigorousness of sex

Genetics

Medical male circumcision

Other sexually transmitted infections (STIs)

Luck (and statistics)

Last updated: 1 December 2019.