The natural history of HIV without ART
The natural history of HIV refers to what happens after infection before taking ART.
It is explained by results from two blood tests: the CD4 count and viral load.
The CD4 count is a marker of how much HIV damages your immune system. Without ART, CD4 counts steadily go down over time in most people.
Viral load shows how much virus is circulating in the body, measured in blood. Without ART, viral load steadily goes up over time.
There are two main phases of HIV infection.
1. Primary infection covers the first six months after infection. It is also called early infection. Acute infection refers to the first few months.
2. Chronic infection covers everything after the first six months. If you are not treated in early infection, chronic infection has two phases: before ART and after ART.
Viral load and CD4 changes
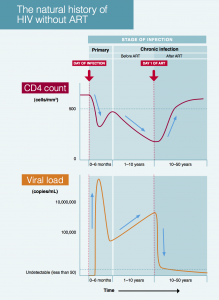
- The two graphs on this page show how the first six months is a time of dramatic activity. Viral load rises into the millions and then, even without ART, it comes back down again.
- The left of both graphs shows what happens to the CD4 count and viral load if HIV is not treated in early infection.
- After an initial drop, the CD4 count quickly recovers, but not completely. Without ART, the CD4 count then declines over many years. How quickly it drops varies between different people. As the CD4 count goes down, the risk of HIV-related illnesses increases.
- In contrast, within weeks of infection, viral load increases to very high levels. This is often many millions of copies/mL.
- Over the next few months the immune system can reduce viral load without ART – but rarely to undetectable levels. Then, over several years viral load steadily increases again.
- The right side of both graphs show how ART changes everything.
- CD4 and viral load results mirror each other. When one is high or increasing the other is usually low or decreasing – and vice versa.
- On ART, so long as you are good at taking your meds, viral load can stay undetectable for years. Your CD4 count can then steadily increase every year.
- The graphs show average responses. As with all averages, some people will have higher and lower levels. Or the time scale for these changes will be faster or slower for some people.
Last updated: 1 January 2025.

