

CHAI marketing report 2026: children still left behind
16 November 2026. Related: Treatment access, On the web.
Simon Collins, HIV i-Base
On 16 November 2026, CHAI released the 17th annual marketing report.
Although framed positively as showing some levels of recovery since 2025, including access to injectable PrEP, other important details give a much bleaker impression.
The detailed 86-page report includes sections on ART access for both adults and children, advanced HIV, PrEP, HIV testing and stockouts.
The examples of countries whose data doesn’t follow the average levels reported are also a concern.
The report is based on latest data until Q2 2026 from nine countries, and summary points include:
- Nearly a year into the lenacapavir access programme, 170,000 people in nine sub-Saharan African countries are using injectable PrEP. Of these, 86,000 are in South Africa.
- The total number of adults on treatment is 3% above 2024 levels, but new adult initiations are down 20%.
- HIV testing remains 17% below 2024.
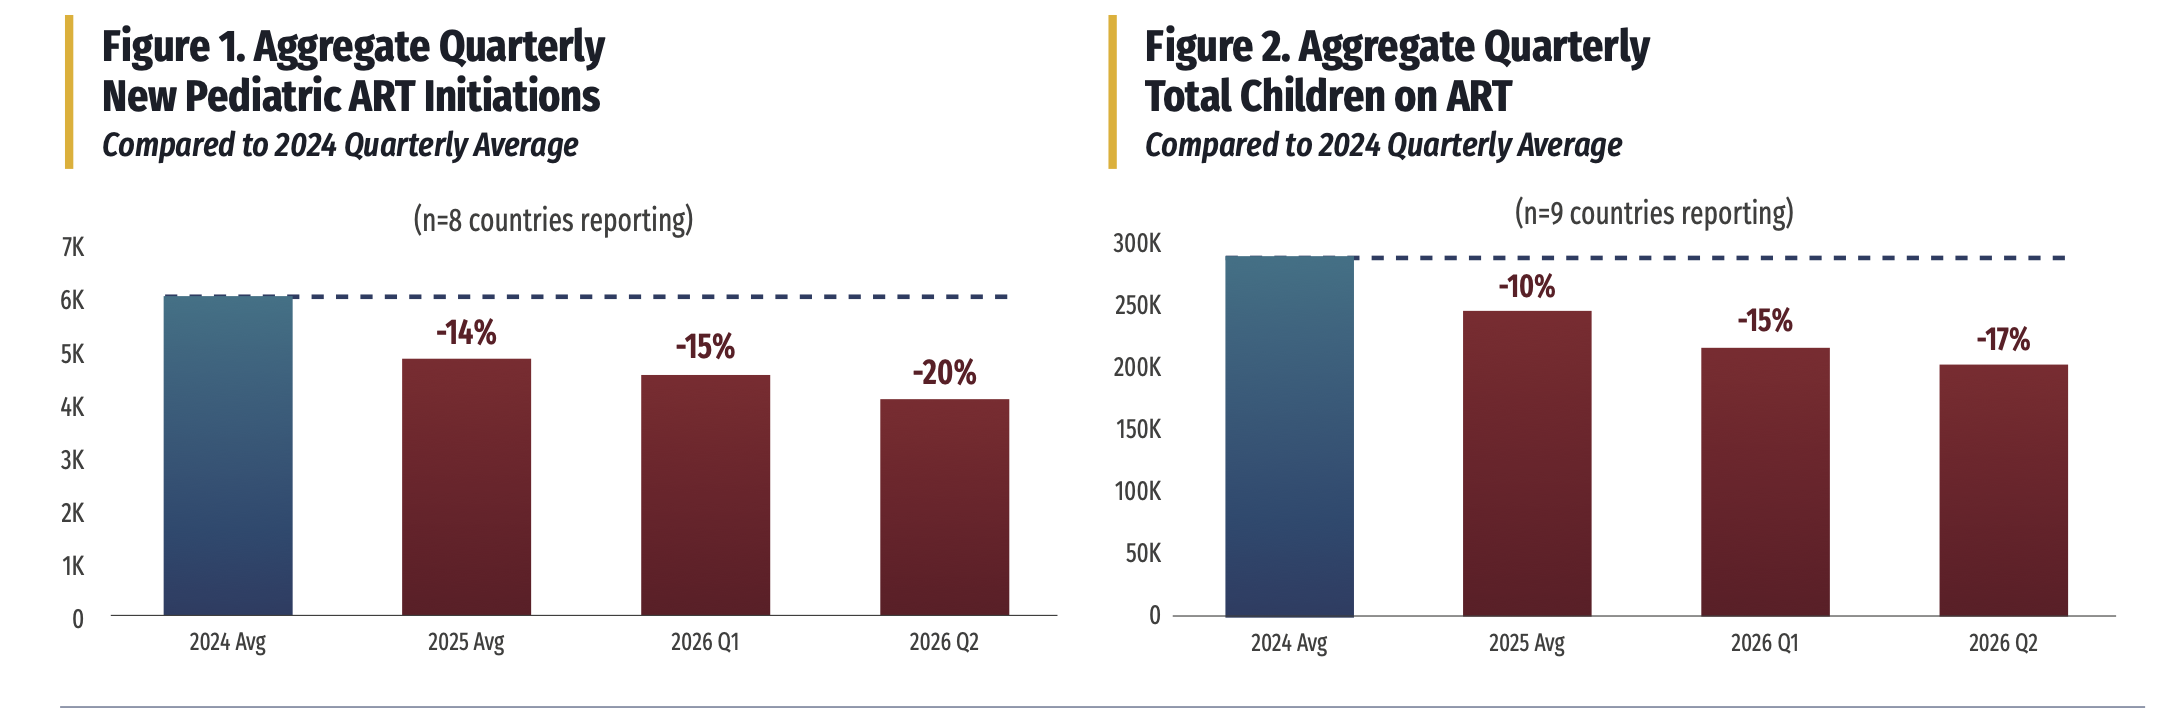
- There are now 17% fewer children on ART compared to 2024.
- 20% fewer children started ART this year.
- Care of advanced HIV (AHD) has dropped, with 32% fewer HIV tests which are essential to effective management. This is despite a full package of AHD care costing only 15% more than ART alone.
- International HIV funding fell to US$7.3 billion in 2025, the lowest since 2007.
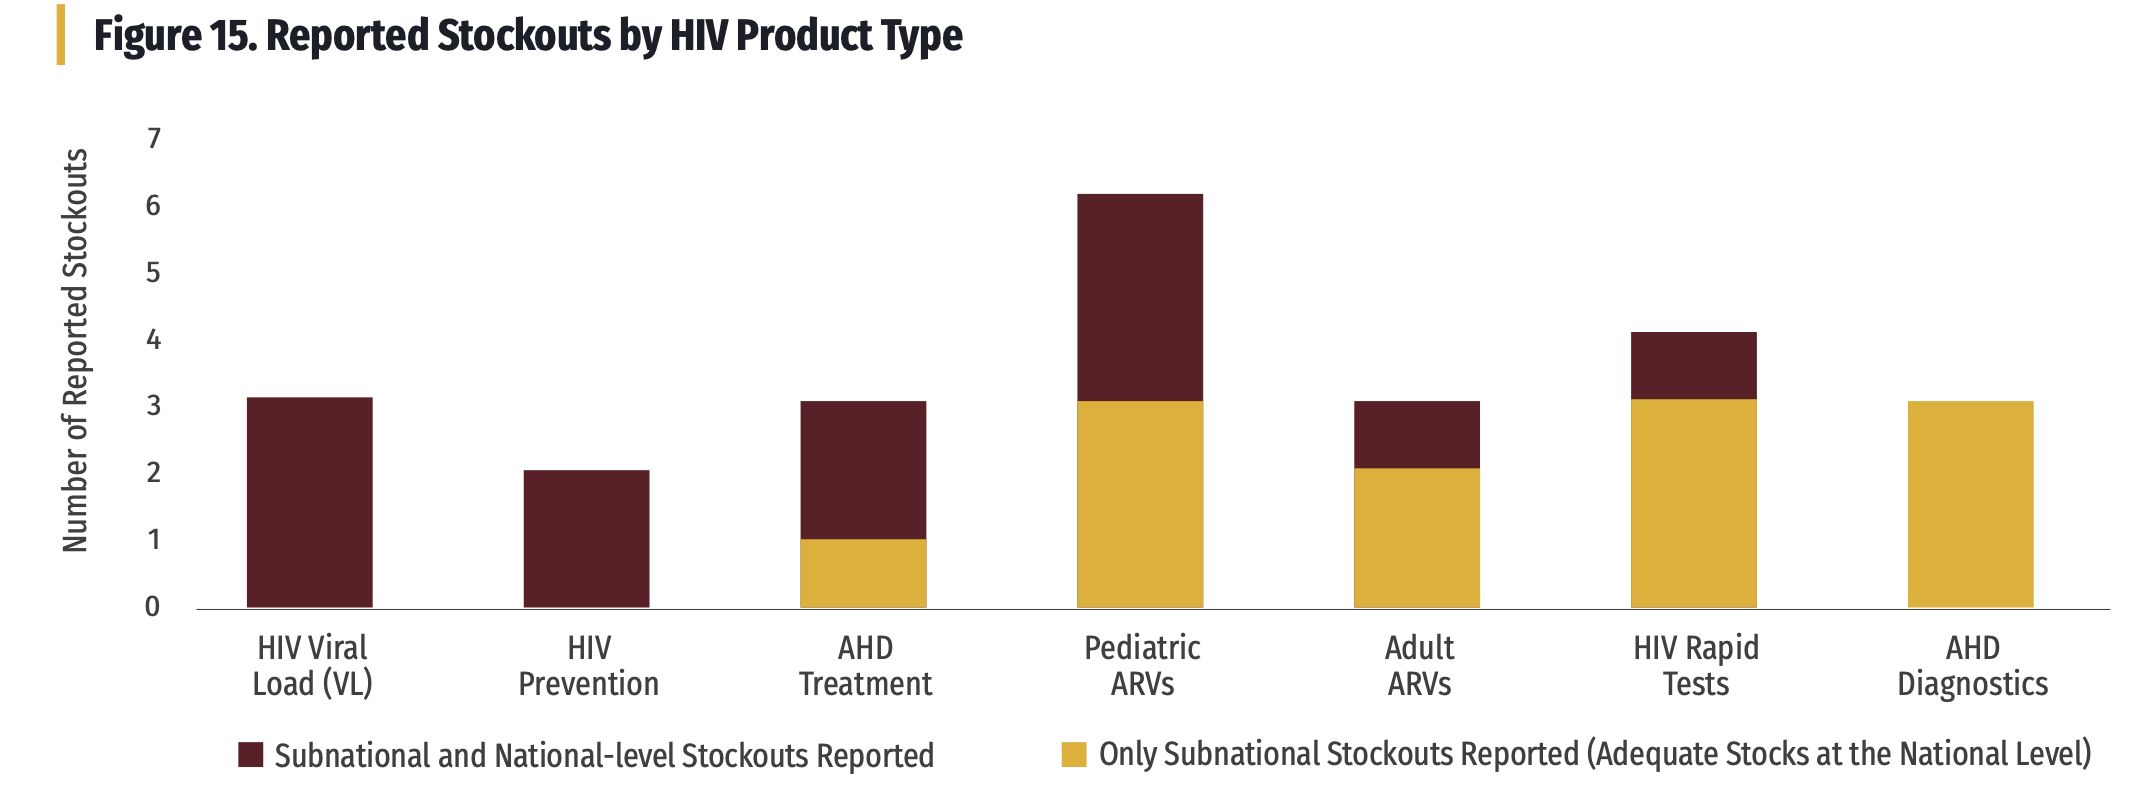
- Fragile supply chains mean that less than four months stock is reported across five counties.
The report also notes that “returning to 2024 levels is not the same as being on track to end HIV as a public health threat, and closing that gap will require renewed global investment and focus”.
Read the report online (PDF)
www.clintonhealthaccess.org/wp-content/uploads/2026/11/2026-CHAI-HIV-Market-Report.pdf