
9. Appendix 9: Examples of resistance test reports
Sample of genotype test
Most resistance tests in the UK use the Stanford database (or similar resource) to generate a resistance report.
The list of mutations is put into an online resource that generates the report. Personal identification information is also included in real reports.
The sample below shows the section of a sample report for nukes and NNRTIs.
Example of resistance report from Stanford database


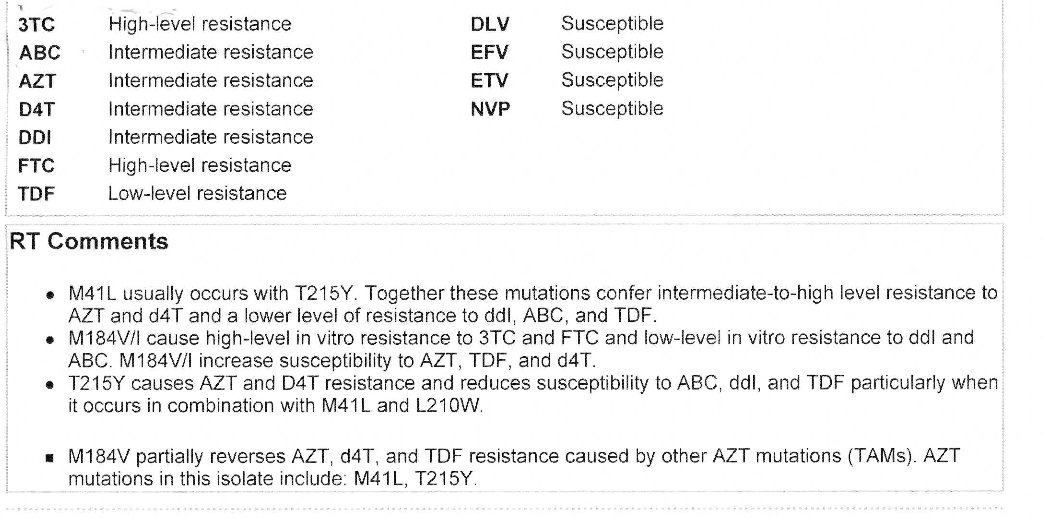
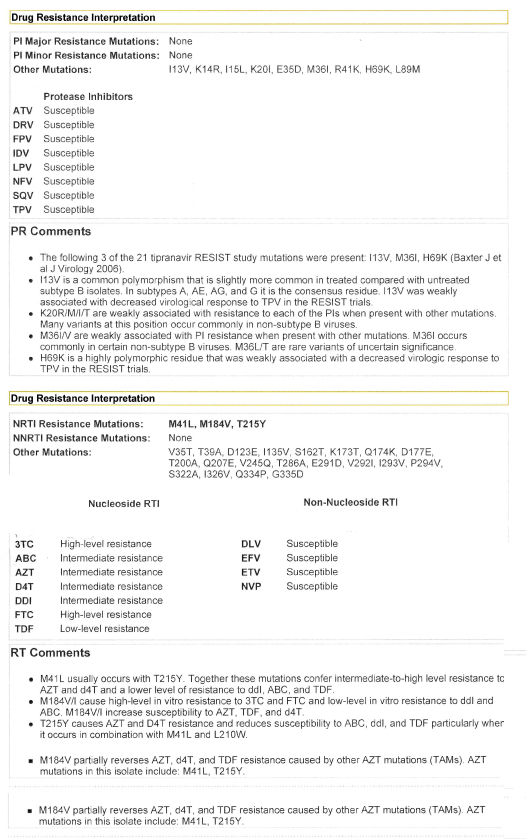
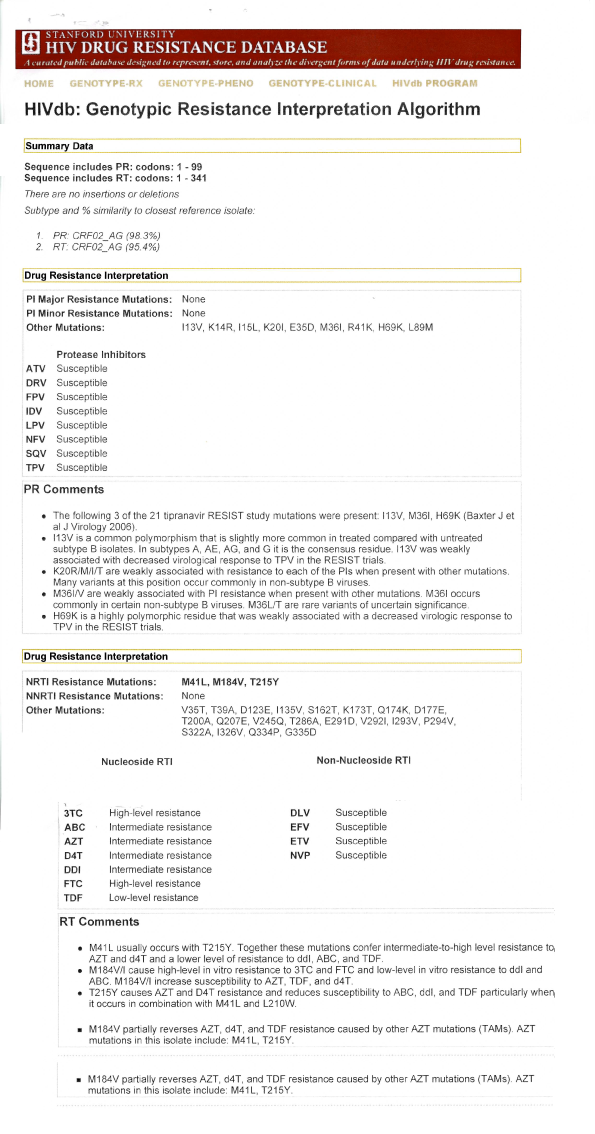
Source: Stanford database – For a full explanation see information on the Stanford website.
Sample virtual phenotype test
The second example is from the virtual phenotype from Virco called VircoTYPE.
Please note that this test was withdrawn in November 2013 because of low use.
It is included here as an example of how phenotype results are linked to genotypic mutations – and partly for historical reasons.
The mutations that were found in the sample are listed above each drug class, ie for nukes (NRTIs), NNRTIs and PIs.
The fold change reported for each drug – ie 8.7 for zidovudine (AZT) in this first example – ie the predictated phenotypic.
The cut-offs in the next two columns refer to the lower (less than 20% imapct) and upper (more than 80% impact) ranges.
The next column shows the result of the analysis. If the fold change is below the lower cut-off the drug is sensitive. If it is between this range the drug is intermediate with a reduced response. If it is above the upper cut-off it is resistant.
The second page of a Virco report includes mnore detailed table showing the predicted phenotypic results more graphically.
Confidence intervals are included for each fold change result which gives you an idea of how many samples in the Virco database had similar mutations to your sample.
For an explanation of these reports see the detailed information on the Virco website.
Virtual Phenotype sample report (Virco) – page 1
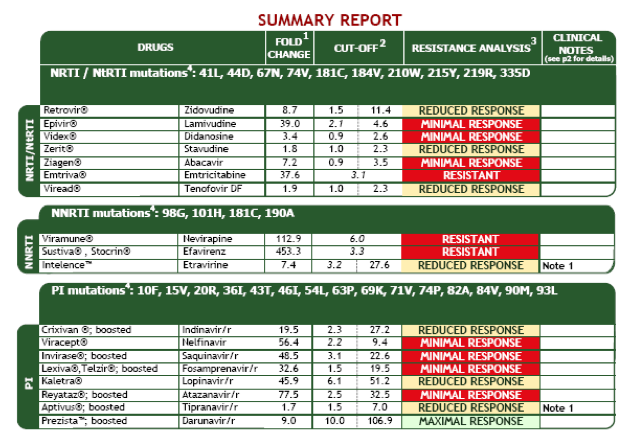
Virtual Phenotype sample report (Virco) – page 2
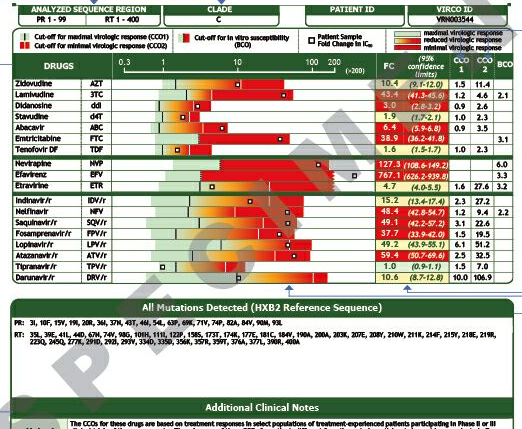
Source: Virco Diagnostics.
Last updated: 1 January 2023.
